Mongolia's GDP has swung from 2011's 17% growth to a mere 1.6% in 2016, back up to a 5% or more growth that exceeds that of saturated economies in the developed world. We'll walk through the country's GDP situation, and touch briefly on the commodity export market in the US.
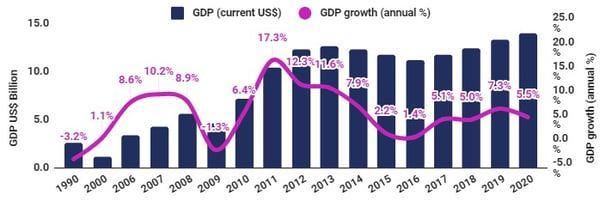
Source: World Bank (2018-2020 figures estimated only)
The 2012 election cycle gave rise to political conflicts and legal reforms that led to constraints on foreign investment in the minerals sector. The period 2012-2016 also witnessed the slowdown in China, which placed downward pressure on global commodity prices, thus limiting the profitability of Mongolian mineral exports.
With new investment-promoting legislation, cost-reducing infrastructure projects, and rebounding mineral prices in China, Mongolia has now rediscovered strong levels of growth. Mongolia, compared with other emerging countries, outperformed in terms of GDP growth in the past few years, with the exception of 2015 and 2016.
In the future, the IMF has expressed its hope of assisting the creation of a less cyclical economy in Mongolia, whereby an eight percent per annum growth rate is maintained.
Comparative real GDP growth
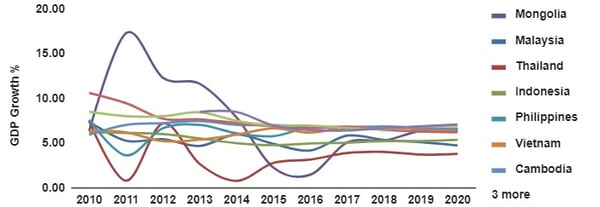
Source: World Bank
The country’s past and future performance is heavily linked to the mineral resource sector. Mongolia is now estimated to hold more than US$1.3 trillion worth of assets. The massive Oyu Tolgoi copper-gold mine alone, in the southern Gobi Desert, is estimated to contain more than 37 million tonnes (81 billion pounds) of copper and more than 1,431 tonnes (46 million ounces) of gold.
Presently, there are many reserves thought to be unidentified, let alone, extracted, and in the mid-term this could make a sizeable contribution to Mongolian GDP. However, it would be a mistake to view Mongolia purely as a natural resource economy. Mining and related activities make up just over 20% of GDP, and it remains a largely agrarian nation.
The mineral sector has served primarily as a liquidity-generating engine, but has spilled over, stimulating demand in other sectors of the economy. In fact, in recent years the pace of expansion in the retail, information, communication, real estate and financial sectors has been significantly faster than in the mining sector.
Mongolia’s GDP by Sector
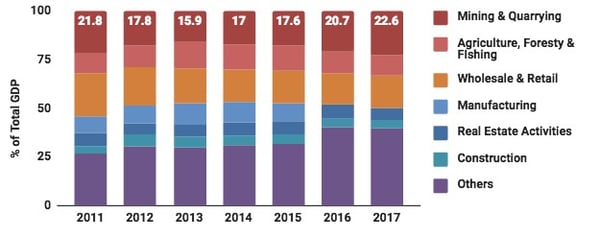
Source: National Statistics Office of Mongolia
Mongolia’s performance against important international benchmarks is mixed. After sustained improvements in the ‘Corruptions Perceptions Index’ there was a fall in its ranking in 2017. It is unclear whether this was mostly driven by the improved performance of other countries. It is possible, though, that fraught negotiations with the Mongolian government by some multinationals may have reduced confidence.
Unfortunately, there was also a fall in the World Bank’s ‘Doing Business’ analysis, as well as the UN’s ‘Human Development Index’. Progress against human development indicators is likely to have been stymied by economic difficulties, with 2017 improvements yet to feed through.
Analysis by the Economist of democratic norms showed a further improvement for Mongolia, in part owing to the recent peaceful transfers of power between parties. Mongolia once again showed an improvement in its global competitiveness. Perhaps one of the most important indicators, this will be welcomed by both government and industry, and is a testament to the efforts of both.
|
Measure |
Previous |
New |
Change |
|
Transparency International “Corruption Perceptions Index” |
87 |
102 |
15 ↓ |
|
World Bank “Doing Business Report” |
56 |
62 |
6 ↓ |
|
United Nations “Human Development Index” |
90 |
92 |
6 ↓ |
|
The Economist “Democracy Index” |
61 |
60 |
1 ↑ |
|
World Economic Forum “Global Competitiveness” |
104 |
101 |
1↑ |
The Gini coefficient, which measures inequality in income distribution, stands at approximately 34 out of 100 for Mongolia, placing it more favorably than developed countries like even the United States. Despite perceptions of widening income equality, broad economic expansion has trickled down to the general populace.
Average monthly wages have increased over eightfold in the past decade, which has led to the rise of a burgeoning consumer economy. Mongolia has seen development of retail malls, restaurants serving foreign cuisine and luxury housing. Consequently, real estate prices have increased markedly in the best buildings.
Average Wage in Mongolia
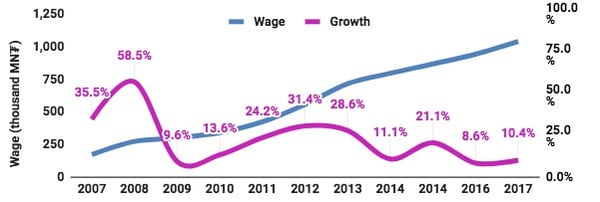
Source: National Statistics Office of Mongolia
International Trade
The 2017 total trade balance was US$1.9bn in surplus. The total turnover was up by 27% on a year-on-year basis. The total value of exports increased 26% in volume compared with the preceding year, amounting to US$6.2bn. Imports were up 29% to reach US$4.3bn .
Mongolia exported 88% of its commodities to China, making it heavily dependent on demand from its southern neighbor. Imports are sourced from countries such as China, Russia, Japan, Germany, Korea, and the USA. Mongolia’s lack of diversification in export products and trade partners leaves the economy vulnerable should there be economic difficulties in China, or a diminution in overall demand for commodities.
Mongolia’s Export & Import & Balance of Trade
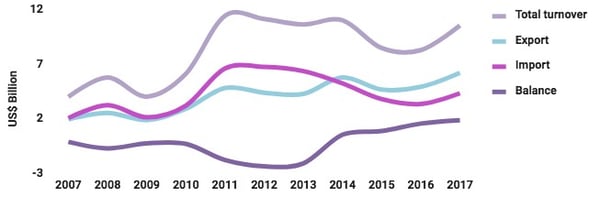
Source: National Statistics of Mongolia
Mongolia’s main exports consist of mineral ores used to produce industrial commodities and precious metals. Copper is historically - and currently - the most significant commodity in Mongolia, due to the mine at Erdenet as well as recent developments at Oyu Tolgoi. Coking coal was the most significant in terms of both volume and value in 2017. Significant sources of export revenue include: coal, gold, iron and zinc concentrates from ore, and crude oils. The collective value of Mongolia’s main exports in 2017 was US$5.3bn .
Export Countries in 2017 Import Countries in 2017
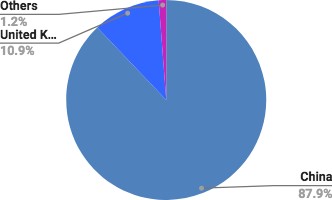
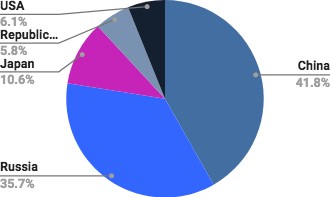
Source: National Statistics Office of Mongolia
Mongolia’s Top Export Commodities
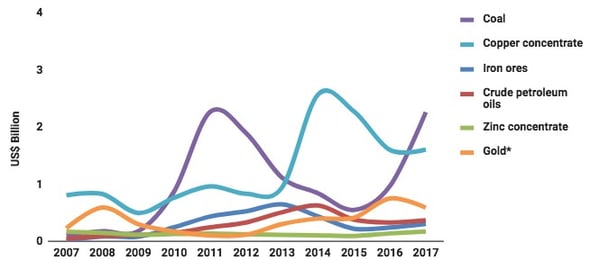
Source: National Statistics Office of Mongolia; *Gold, unwrought or in semi-manufactured forms
Copper, coal and gold have continued to make up the lion’s share of exports, and in total these amounted to US$4.48bn in 2017. Exports of mining commodities rose to nearly US$2 Billion in the first four months of 2018, compared to just over US$1 Billion and $1.5 Billion in the first four months of 2016 and 2017, respectively. In 2017, Mongolia exported US$1.6 billion of copper concentrate, US$2.2 billion worth of coal, and US$595 million worth of gold products.
The copper price decreased until 2016, before rising in 2017. Coal had a particularly stellar 2017. After a very promising conclusion to 2016, 2017 proved disappointing for gold. As this important industry develops, it will make a meaningful contribution to economic growth. Exports of secondary importance include other minor metal concentrates as well as textiles produced from wool and cashmere.
If you would like more information on the Mongolian GDP, commodity exports, and related topics, download our free Real Estate Report.